Weekend Briefing No. 26

Good Saturday morning and welcome to this weekend's briefing. This week we look at the rise (and success) of an AI-generated influencer, how ChatGPT is affecting online labor, Amazon announces Q, and a big EV battery news from Toyota.
An AI-generated influencer makes a lot of money
Talk about news of the weird, but a Spanish agency got tired of flaky influencers and just created their own with AI. Aitana, a 25-year-old woman from Barcelona, is the new AI-generated influencer who makes up to 11,000 Euros per month.

Aitana has 122,000 followers on Instagram, where her profile states she is a digital creator. An update on her story feed even shows a real-life breakfast bowl, as her creators seek to give her the illusion of a life.
“Even after the media revealed she was an AI creation, many followers still expressed their love for her. The key lies in crafting a relatable personality so that her followers feel a genuine connection,” Núñez said.
I checked out her Instagram and found the AI-generated images very good. Images like this one could fool me if I didn't know she was fake.
Generative AI is affecting the online labor market
ChatGPT and the rise of LLMs across many different industries are having an impact on labor. This empirical analysis highlights that online freelancers are the most affected and there's been a drop in their monthly earnings.

Across the board, we find that freelancers who offer services in occupations most affected by AI experienced reductions in both employment and earnings. The release of ChatGPT leads to a 2% drop in the number of jobs on the platform, and a 5.2% drop in monthly earnings.
There's no need to panic as the researchers believe that it's the lower value online work that's being affected. If you're a high quality producing freelancer you shouldn't be affected.
Toyota boasts new battery technology
I was listening to a report on Bloomberg the other day that said the global automotive market is about $2.5 trillion in size. The highlighted that China's domestic electric vehicle (EV) market is about 30%. That's huge and the analyst when on to say they were forecasting a 30% EV market in the USA by 2030 as well. Now, Toyota reports that they have a better battery that let's EVs travel farther and charge faster.

According to Toyota, as Yahoo Finance reported, these batteries could deliver 745 miles on a single charge, while recharging would only take around 10 minutes.
This is big news if the claims are verified. This new battery technology, coupled with a growing domestic EV market, should make a solid dent in the climate crisis. Just like the AI chip wars, the EV market is starting to heat up and it bears watching.
Amazon announces Q
And squeaking in under the wire for this weekend's briefing was a big announcement by Amazon at their re:Invent conference. Amazon announces Q, a RAG application that's aimed at taking on Google and OpenAI/Microsoft. It looks pretty slick and let's users connect to multiple datastores. It has a simple but pleasing interface too boot!
Companies can also give Amazon Q permission to work with their corporate data that isn’t on Amazon’s servers, such as connecting with Slack and Gmail.
And it's affordable coming in at $20 per month compared to Microsoft and Google's offerings.
Pricing for Amazon Q starts at $20 per user each month. Microsoft and Google both charge $30 a month for each user of the enterprise chatbots that work with their email and other productivity applications.
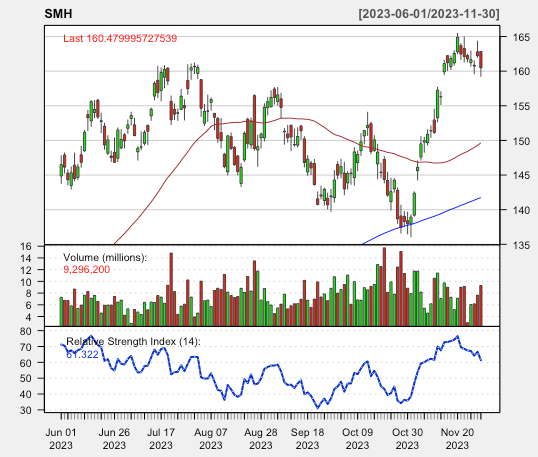
NVDA & SMH stock prices
This week's infographic happens to be another stock chart, this time of Nvidia (NVDA) and the Semiconductor ETF (SMH). Both hit recent all-time highs in their prices but are pulling back. Part of the reason why their hitting these new highs is a combination of several factors aligning. One is the insatiable need for GPUs for LLMs and two, the Biden Administration's CHIPS and Science Act.
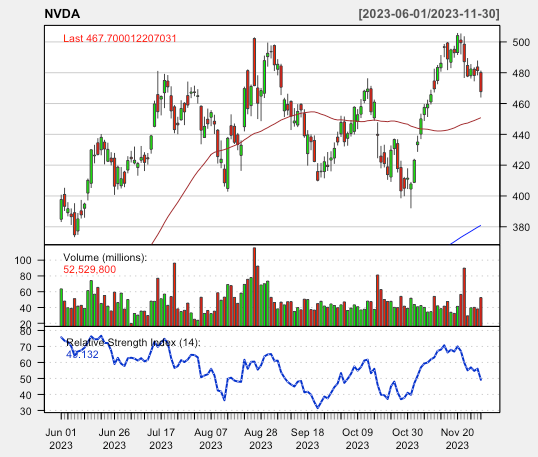
Right now there are a ton of variables in the Tech world for startups, hardware, and chips, so it's hard to forecast or predict which way NVDA and SMH will go but traders and investors appear bullish on semiconductors for both.
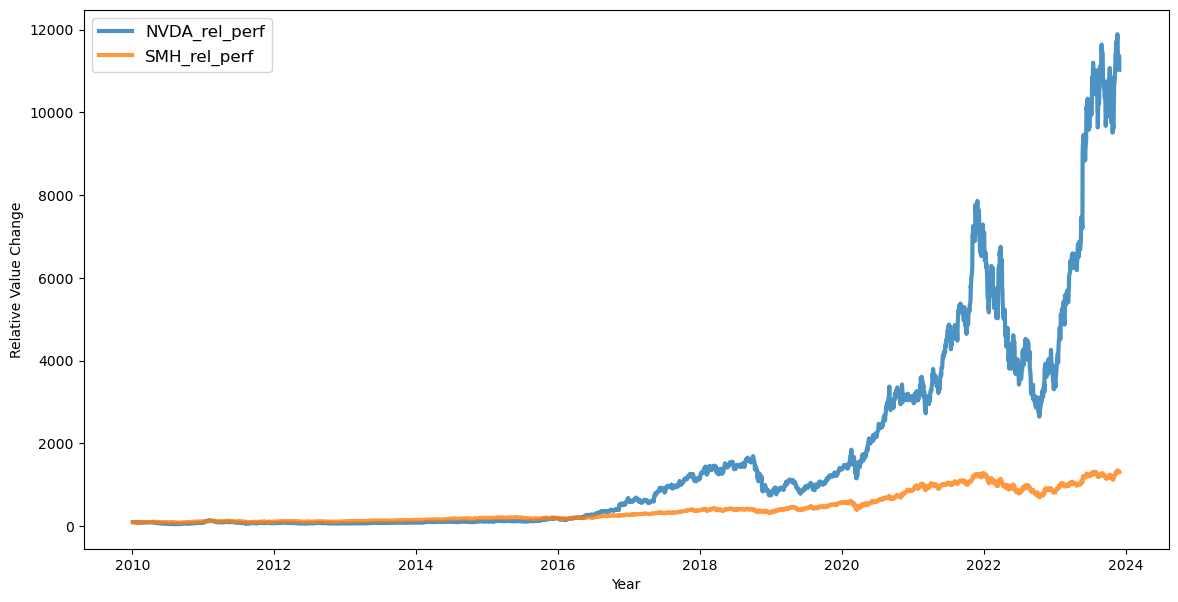
That said, if you had invested in only NVDA since 2010, you'd have made a lot more money than just buying SMH. That's the difference between diversifying across the board or selective stock picking.
The R code I used to make this graphic is below:
require(quantmod)

getSymbols('NVDA', from='1900-01-01') #,

candleChart(NVDA, subset='last 6 months', up.col='green',dn.col='red',color.vol = TRUE,theme="white") #

addSMA(n = 50, on = 1, with.col = Cl, overlay = TRUE, col = "brown")
addSMA(n = 200, on = 1, with.col = Cl, overlay = TRUE, col = "blue")

addRSI(n=14, maType="EMA", wilder=TRUE)
The Python code for the relative performance chart is below:
import pandas as pd
import numpy as np
import yfinance as yf
import matplotlib.pyplot as plt
import datetime as dt

tickers =['NVDA', 'SMH']

start=dt.datetime(2010,1,1)
end = dt.datetime.now()

assets=yf.download(tickers,start,end)['Adj Close']

assets_indexrow=assets[:1]

for ticker in tickers:
    assets[ticker+'_rel_perf']=(assets[ticker]/ assets_indexrow[ticker][0])*100

assets.drop(columns =tickers, inplace=True)

plt.figure(figsize=(14, 7))
for c in assets.columns.values:
    plt.plot(assets.index, assets[c], lw=3, alpha=0.8,label=c)
plt.legend(loc='upper left', fontsize=12)
plt.xlabel('Year')
plt.ylabel('Relative Value Change')


Member discussion