Weekend Briefing No. 16

Good Saturday morning! Welcome to this Weekend's Briefing. In this weekend's newsletter, I highlight RAG vs. LLM, modeling climate change for policy creation, and the doughnut economy! Oh, and there's a neat infographic of beer too!
Interesting data points
- Compute for training LLMs has been doubling every 3.4 months
- Japan has the largest (28.8%) growing senior population (65 years+)
- In the USA, the mean age of death is 73, the median age of death is 77, the life expectancy age is 78.8, and the modal age of death is 87
Retrieval augmented generation (RAG)
If you were to ask me, LLMs have been superseded by RAG. What's RAG? It's Retrieval Augmented Generation and it's exciting. Why is it exciting? Because it overcomes a lot of the hallucination problems with Generative AI!
The problem with LLMs is that they become static once they're trained. They can't be refreshed with new data until you retrain them. So to overcome this problem, researchers and innovators in this space have come up with a way to add new data on top of the LLM when requested. It uses the new data and the power of the LLM to summarize and generate text as needed!

Retrieval Augmented Generation means fetching up-to-date or context-specific data from an external database and making it available to an LLM when asking it to generate a response, solving this problem. You can store proprietary business data or information about the world and have your application fetch it for the LLM at generation time, reducing the likelihood of hallucinations. The result is a noticeable boost in the performance and accuracy of your GenAI application.
I love this because it has so many broad applications and can spawn so many new and powerful products. Imagine using an open source LLM like H2O's as a base LLM, then build a data connector to Elastic Search or Confluence and then start asking the LLM to summarize something specific that comes from the ingest data.
In summary RAG > LLM.
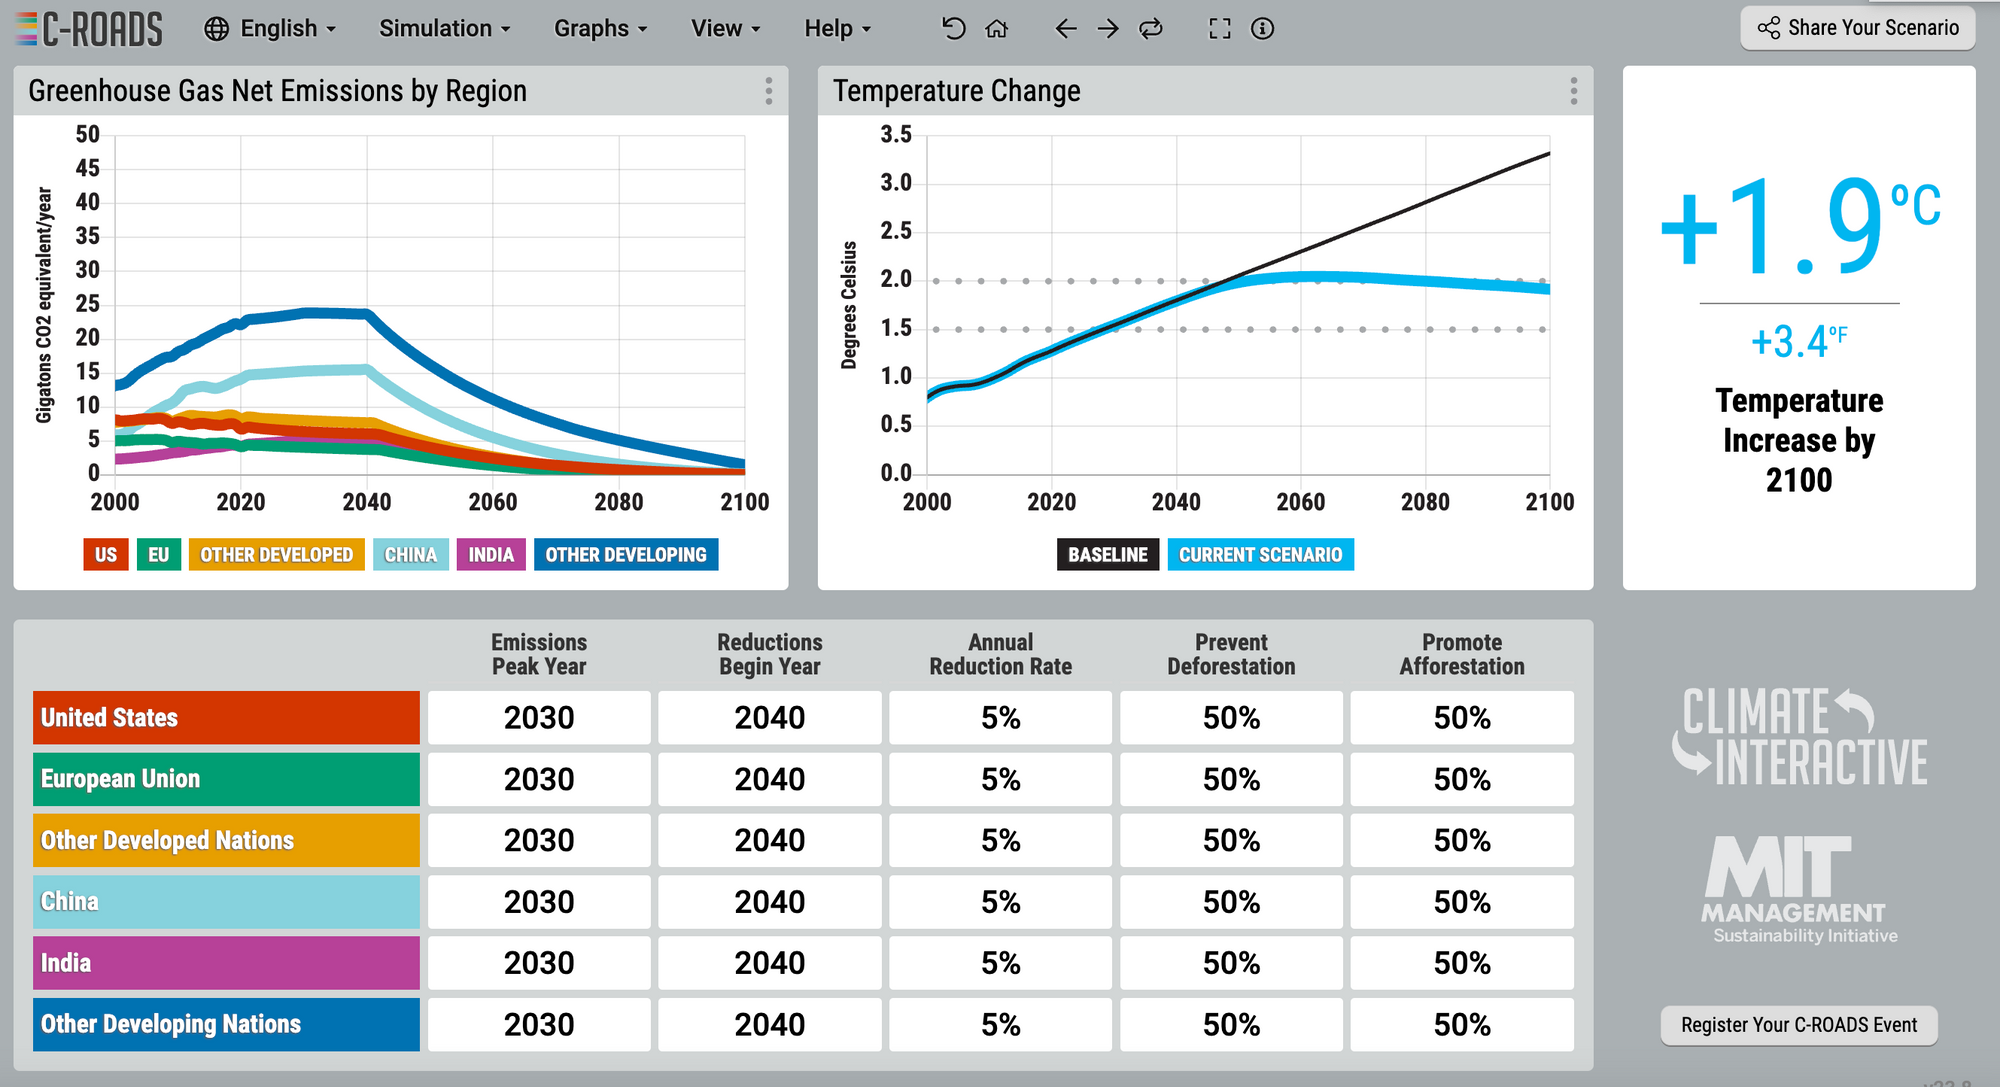
Modeling the effects of climate change policy
MIT researchers have created a simulation portal that allows policy makers (politicians) to sit around the table and model (in real time) what their policies toward greenhouse gas emission will do for the future.
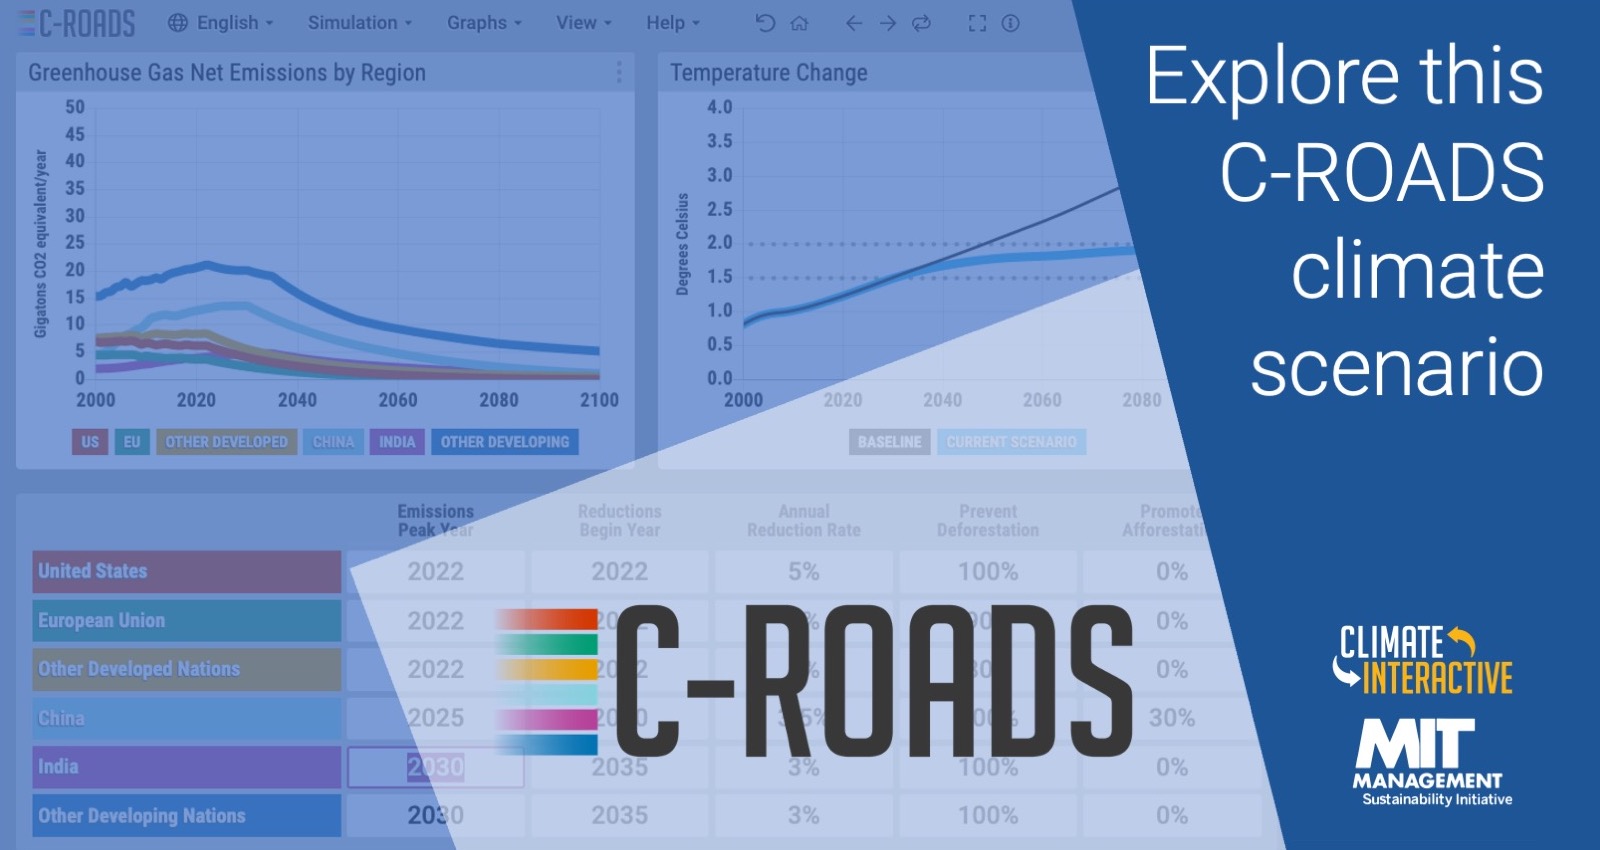
C-Roads is an eye opening simulation site that lets users enter the percentages of proposed greenhouse gas reductions targets and what years they're to be achieved. In addition, it allows policy makers to model how much reforestation could affect their greenhouse gas targets!
Doughnut economics
I finally got around to reading listening to the majority of Kate Raworth's book, Doughnut Economics: Seven Ways to Think Like a 21st-Century Economist. As someone with an MBA, I found the book refreshing because it helped me reconcile the creative and destructive force of capitalism into something more holistic and sustainable.
?ref=thomasott.io#/media/File:Doughnut_(economic_model).jpg) Contributors to Wikimedia projects
Contributors to Wikimedia projectsThe resonating point of the book, for me, was that we're too focused on using GDP (Gross Domestic Product) as the be all and end all measure of success. Success is lifting everyone up in an environmentally and a sustainable way. She points out several ironies, with one author Adam Smith who wrote the seminal "Wealth of Nations" had to move back in with his aging mother to write the book. She cooked, cleaned, and supported him during this endeavor, but Mr. Smith never included domestic labor as part of the "invisible hand of the market," when it clearly is.
Women, for centuries, have been providing free domestic labor that keeps this economy going. Ms. Raworth argues that if we choose to focus on system structures and the sustainability of social and environmental systems for all people, that we'll end up building a more just and healthy world, for all.
I highly recommend this book to all my readers.
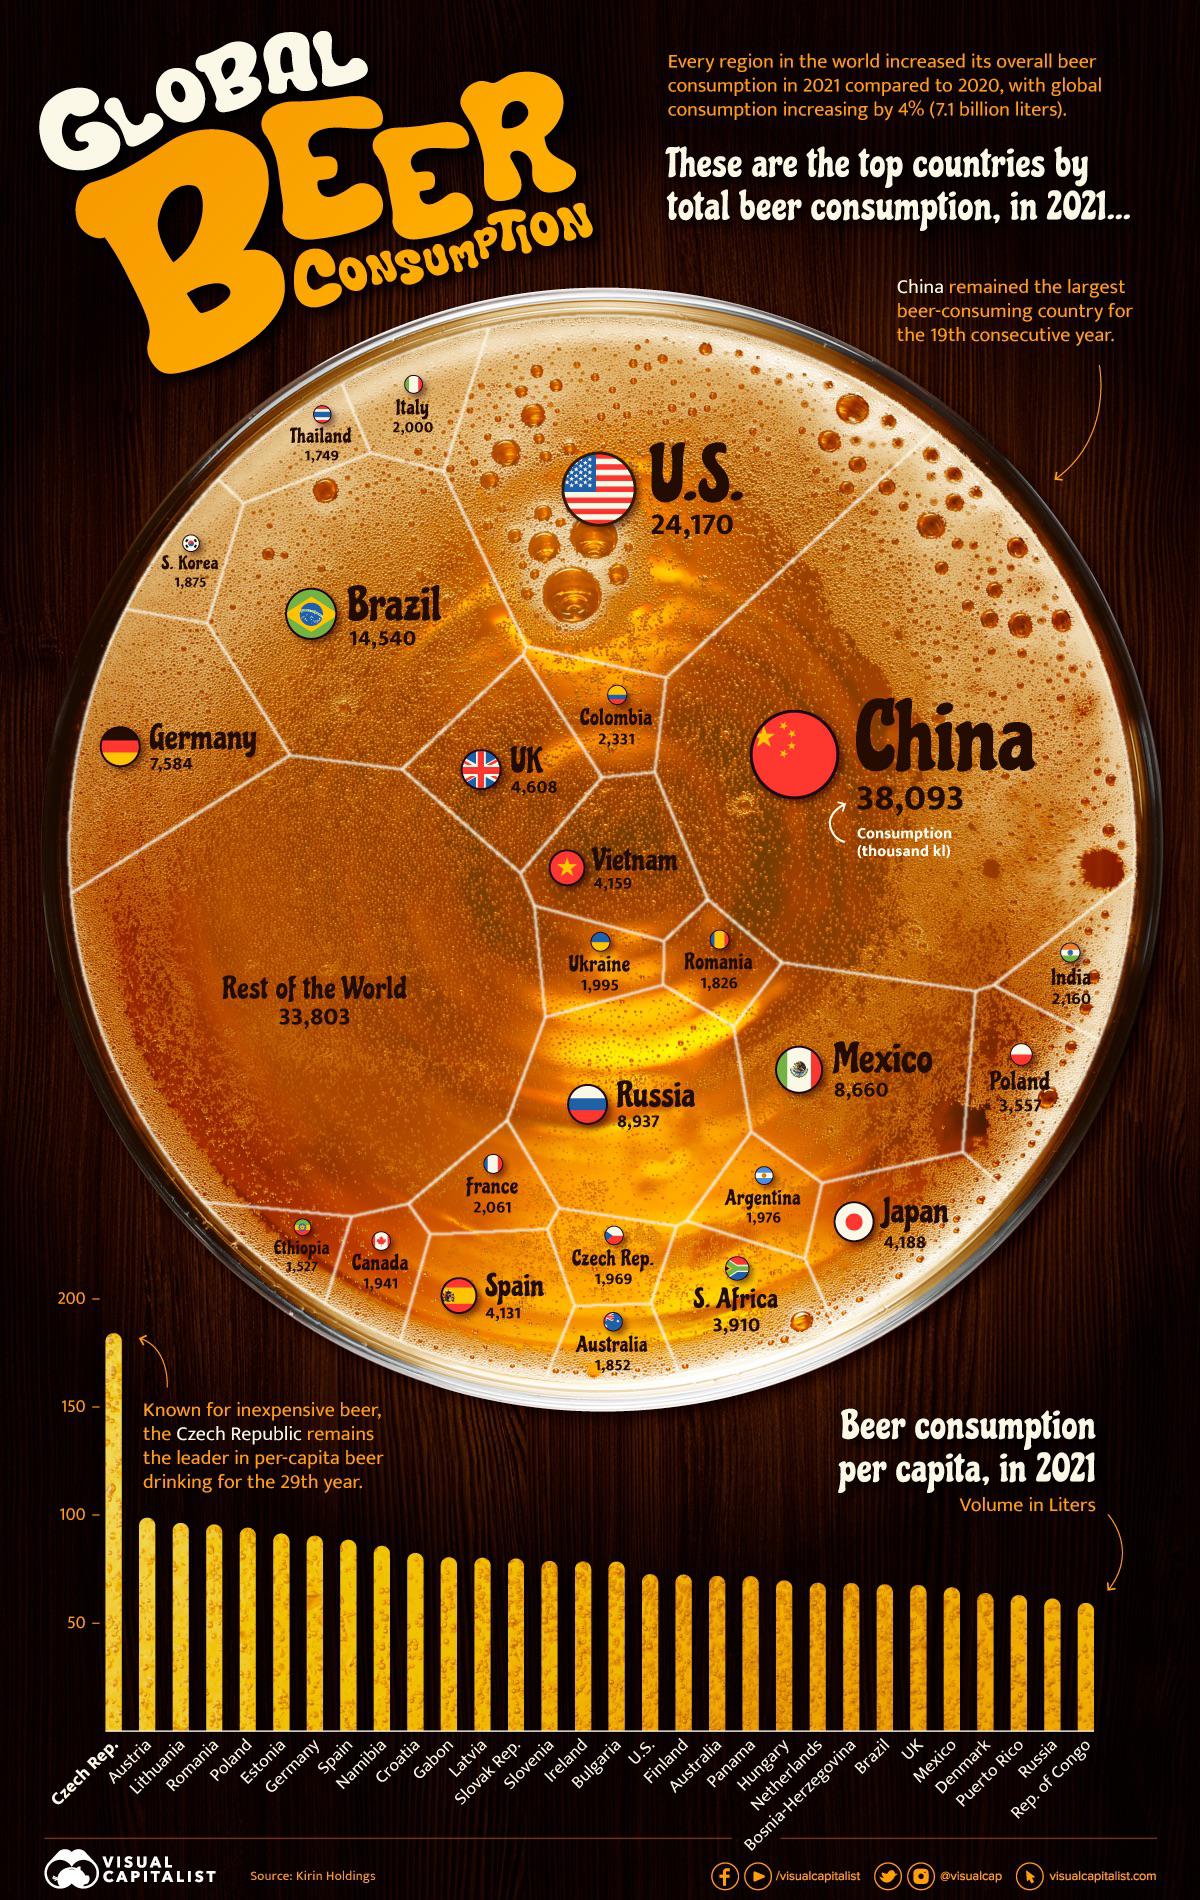
Infographic of the week
This week's infographic is about 2021's beer consumption! I never realized just how big of a beer market China is!


Member discussion